EV vs Diesel High Mileage: Does the Maths Work in 2026?
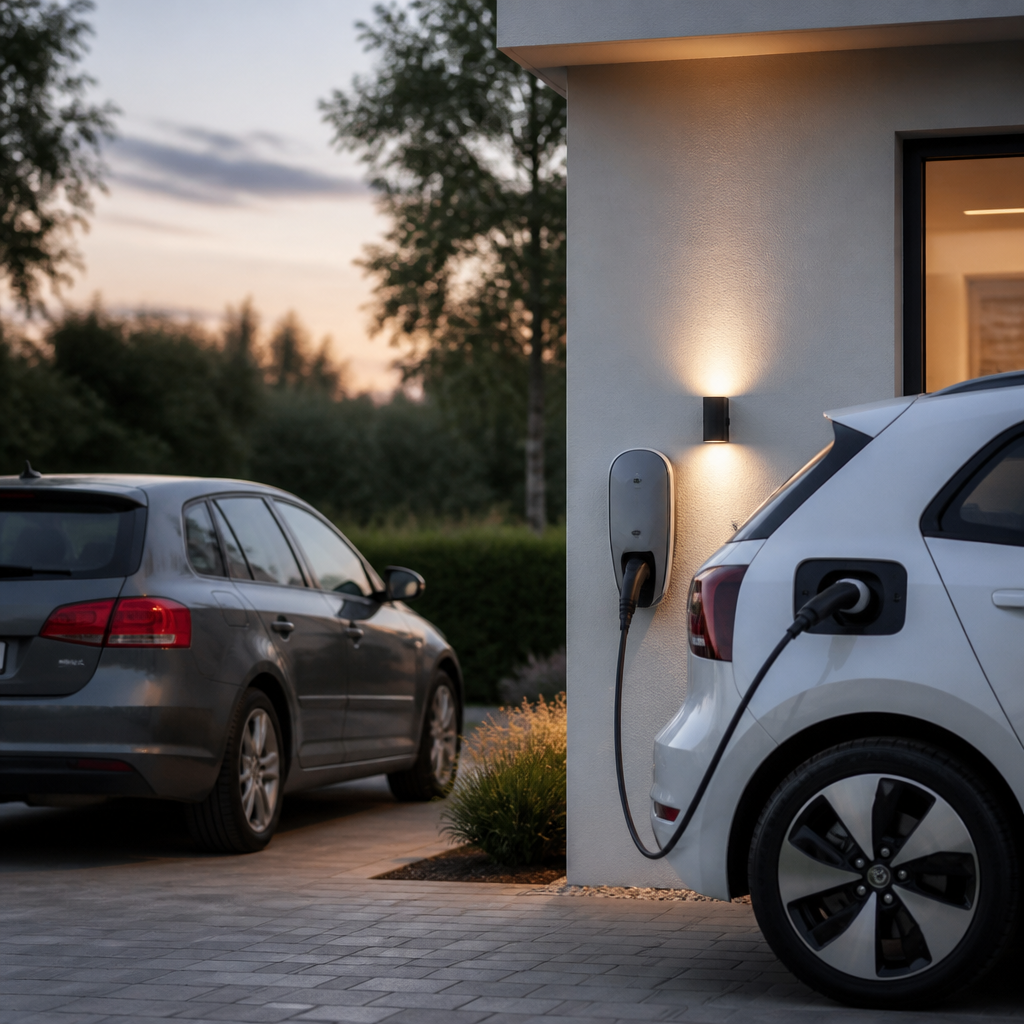
EV vs diesel high mileage comparisons often go in circles: the EV wins on energy, the diesel wins on purchase price and resale, and the buyer is left to decide. For drivers covering 30,000 km a year or more, the question is more answerable than it was, but the result still hinges on three variables: annual distance, the share of energy you can charge at home, and how fast a high-mileage diesel loses value. This article runs the arithmetic with explicit assumptions, identifies where the numbers break, and states which drivers should switch and which should keep the diesel.
Table of Contents
- Quick Takeaways
- How the Annual Cost Model Works
- Diesel Fuel Economy in Practice
- Electricity Cost and Charging Losses
- Purchase Price, Depreciation and Residual Value
- Maintenance and Wear at High Mileage
- Side-by-Side Cost Comparison
- Where the Break-Even Point Falls
- Frequently Asked Questions
- References
Quick Takeaways
Key Insight
Explanation
Annual distance sets the break-even
Run every calculation at your real annual kilometres. Fixed costs such as the purchase premium are spread across more kilometres as distance rises, so the EV case improves with mileage.
Home charging share decides the energy gap
At €0.30 per kWh at home, the EV's energy cost per kilometre is around 56 percent of the diesel baseline. At €0.60 per kWh on public fast chargers, it exceeds the diesel.
Use measured diesel consumption
Replace manufacturer combined figures with your own fuel receipts. Sustained motorway running usually consumes more than the combined rating suggests.
Model residual value at your target mileage
A car at 150,000 km is a different asset from the same model at 45,000 km. Price comparisons should use mileage-matched listings.
Battery health is the used-EV equivalent of engine condition
Ask for a measured state-of-health figure and charging history before negotiating. Treat a documented degradation trend as a price variable.
Diesel wear risk sits in aftertreatment and injection
Budget for particulate filter and injector faults on high-kilometre diesels. EV maintenance risk concentrates in tyres and thermal system checks.
How the Annual Cost Model Works
Any credible comparison starts from one formula: annual running cost equals annual distance multiplied by energy consumption and unit energy price, plus maintenance, plus depreciation. The Alternative Fuels Data Center's vehicle cost calculator uses the same structure, asking for purchase price, fuel economy by fuel type, average daily distance, the share of highway driving and how often an EV is plugged in during normal use. That plug-in input shows that charging behaviour, not only tariff, changes the result.
Inputs That Actually Move the Result
Four inputs carry most of the weight: annual kilometres, diesel consumption at sustained speed, EV consumption at your typical speed, and the blended electricity price. "Blended" matters. A driver who charges 80 percent at home and 20 percent at fast chargers sits on a different cost curve from one who relies on public networks, and a single per-kWh figure hides that split.
Why Annual Mileage Shifts the Break-Even
The purchase premium and early depreciation are fixed costs, and at high mileage they are spread across far more kilometres. The per-kilometre penalty of an EV's higher entry price falls steadily as distance rises. A driver at 15,000 km a year needs roughly twice as many years to recover the same premium as one at 30,000 km.
Diesel Fuel Economy in Practice
The diesel baseline is where most models go wrong, because the figure on the brochure is rarely the one you pay for. Combined-cycle consumption comes from a standardised test that does not reflect sustained high-speed running. For a motorway-heavy driver, that gap is the largest single source of error in the comparison.
Motorway Consumption Versus Combined Figures
A loaded diesel at 120 km/h, with a roof box or full cabin, can consume materially more than its combined rating. For planning, use 5.5 L/100 km for mixed driving and 6.2 L/100 km for sustained motorway work with load. These are planning values, not measured results for any specific model, and should be replaced with your own figures as soon as you have them.
Building a Baseline From Fuel Receipts
Receipts with the odometer reading at each fill give a consumption figure that reflects your route, load and fuel grade. Divide litres used by kilometres driven and multiply by 100. Keep the sample at least 3,000 km long so that weather and speed variation do not dominate the result.
Pro tip: Record fuel grade and tyre pressure with each fill during the first 3,000 km. Diesel economy shifts with winter fuel and under-inflated tyres, and both errors are easy to avoid when you log them.
Electricity Cost and Charging Losses
The NRDC explainer on EV running costs concludes that an EV will in most cases be cheaper to drive over the long run. Its figures come from a different market, so replace them with your own tariff and fuel price before drawing a conclusion. The EV side of the model depends on the price per kilowatt-hour and the energy you actually draw.
Home Tariff Versus Public Fast Charging
Take 18 kWh per 100 km as a planning consumption for a mid-size EV at mixed motorway speeds. Assuming diesel at €1.75 per litre, the diesel baseline is €9.63 per 100 km. At €0.30 per kWh on a home tariff, the EV costs €5.40 per 100 km, while the same distance on a public fast charger at €0.60 per kWh costs €10.80, which is more than the diesel.
Charging Losses and Consumption at the Plug
BMW's public charging page notes that cost depends on the vehicle's consumption, the selected tariff and the charging location. The third variable is the one most often overlooked. Conversion and thermal losses mean the energy bought at the socket exceeds the energy stored in the battery, so cost per kilometre should be built from energy drawn at the charger, not from the spec-sheet consumption figure.
Purchase Price, Depreciation and Residual Value
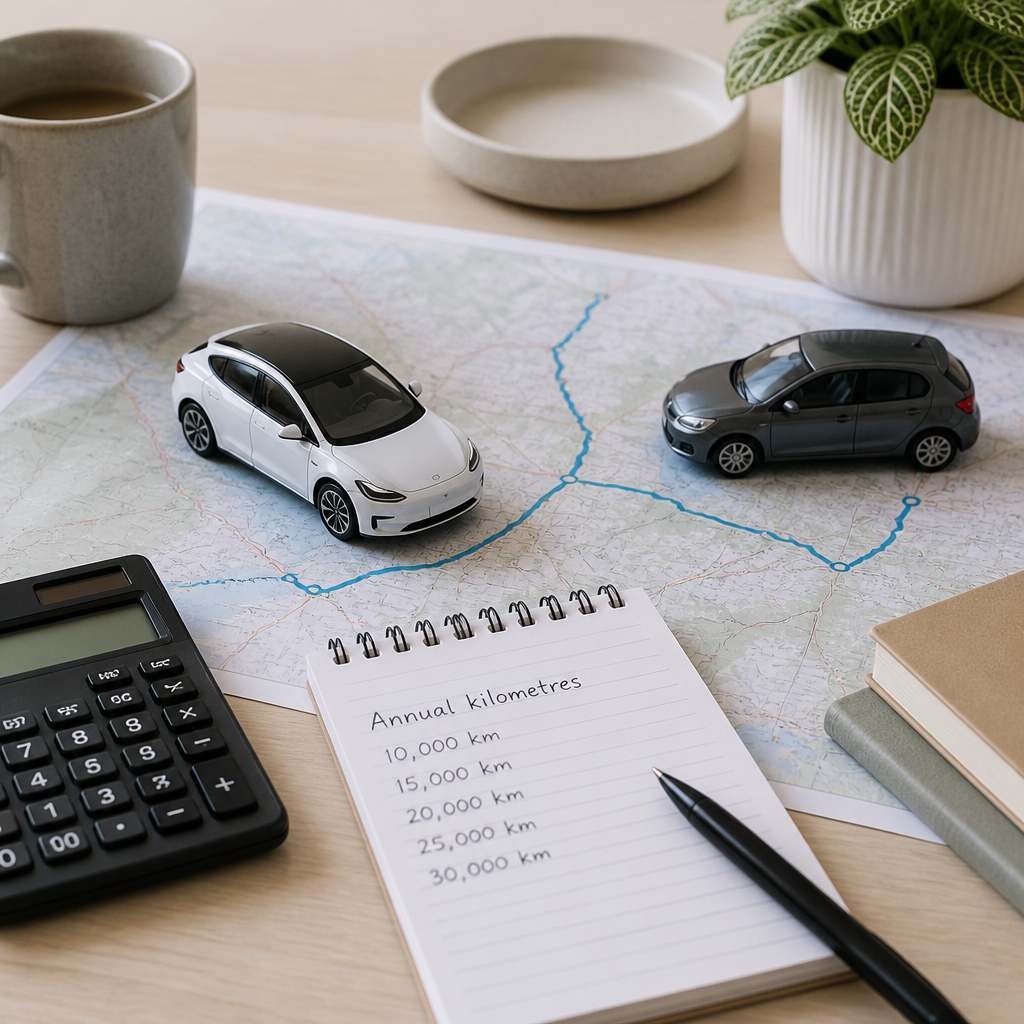
The purchase premium is the first hurdle, and energy savings must recover it before the EV pulls ahead. For a high-mileage buyer, the more useful question is what each car is worth at 150,000 km, not what it costs on the forecourt today. A model that ignores resale will misstate the result in either direction.
Residual Value at 150,000 km
Compare listings at matching mileage. A diesel with 45,000 km and one with 150,000 km are different assets, and their price gap rarely reflects energy cost alone. Low-emission zones and diesel access restrictions in some European cities can narrow the buyer pool for older diesels, so treat resale as a risk factor to test rather than a given.
Battery State of Health in Used EVs
For a used EV, battery state of health takes the place of engine condition as the core diagnostic. Ask for a measured reading and the charging history, and treat a documented degradation trend as a negotiation point. A battery that has seen frequent DC fast charging ages differently from one charged mainly at home on a slow AC tariff, so the history matters as much as the odometer.
Maintenance and Wear at High Mileage
High-mileage diesels carry the most identifiable maintenance risk. The costly items sit in the emissions and fuel systems, and one failure can exceed the energy saving from a year of driving. An EV's maintenance profile is simpler, but it is not zero, and its wear items differ.
Diesel Aftertreatment and Injection Risk
Particulate filters regenerate only under sustained high-temperature running, so a diesel used mainly for short trips is more exposed to blocked filters than one used on motorways. Injector and high-pressure pump faults are the other common high-cost failures on high-kilometre examples. Hold a repair reserve for these items rather than treating the service interval as the full cost.
EV Tyres, Brakes and Thermal Management
Tyres are the main EV wear cost. Heavier vehicles with instant torque tend to wear tyres faster, so tyre choice matters more than on the equivalent diesel. Regenerative braking substantially reduces pad wear, while coolant and battery thermal system checks become scheduled items to budget for.
Side-by-Side Cost Comparison
The table compares a diesel with a battery EV on the variables that move total cost at high mileage. All figures are planning values from the model in this article, so replace them with your own data before deciding.
Cost Factor
Diesel (planning value)
Battery EV (planning value)
Energy cost per 100 km, home tariff
€9.63 at €1.75 per litre, 5.5 L/100 km
€5.40 at €0.30 per kWh, 18 kWh/100 km
Energy cost per 100 km, public fast charging
€9.63 at €1.75 per litre, 5.5 L/100 km
€10.80 at €0.60 per kWh, 18 kWh/100 km
Main maintenance risk
Injectors, particulate filter, high-pressure pump
Tyres, coolant and battery thermal checks
Residual value driver
Mileage, service records, local access rules
Battery state of health, charging history
Purchase premium
Typically lower at point of sale
Typically higher, though the gap is narrowing in many segments
Annual Running Cost Model
At 30,000 km a year with home charging, the energy gap is roughly €1,270 in favour of the EV. Public-only charging at the same distance reverses it, leaving the EV about €350 more expensive than the diesel on energy alone.
Risk Profile at High Mileage
Diesel cost risk is lumpy and concentrated in a few expensive repairs. EV cost risk is smaller in frequency but depends on battery health and tyre life. Price a repair reserve for both options, not only the cheaper running line.
The purchase premium is recovered only as fast as the energy gap accumulates, so the outcome is decided by annual kilometres and where the car is charged, not by list price.
Where the Break-Even Point Falls
The break-even point depends on distance, charging mix and purchase premium together. The scenarios below isolate the energy gap that the premium has to be recovered from, with depreciation and maintenance excluded so that the energy effect stands alone.
Scenario at 30,000 km a Year
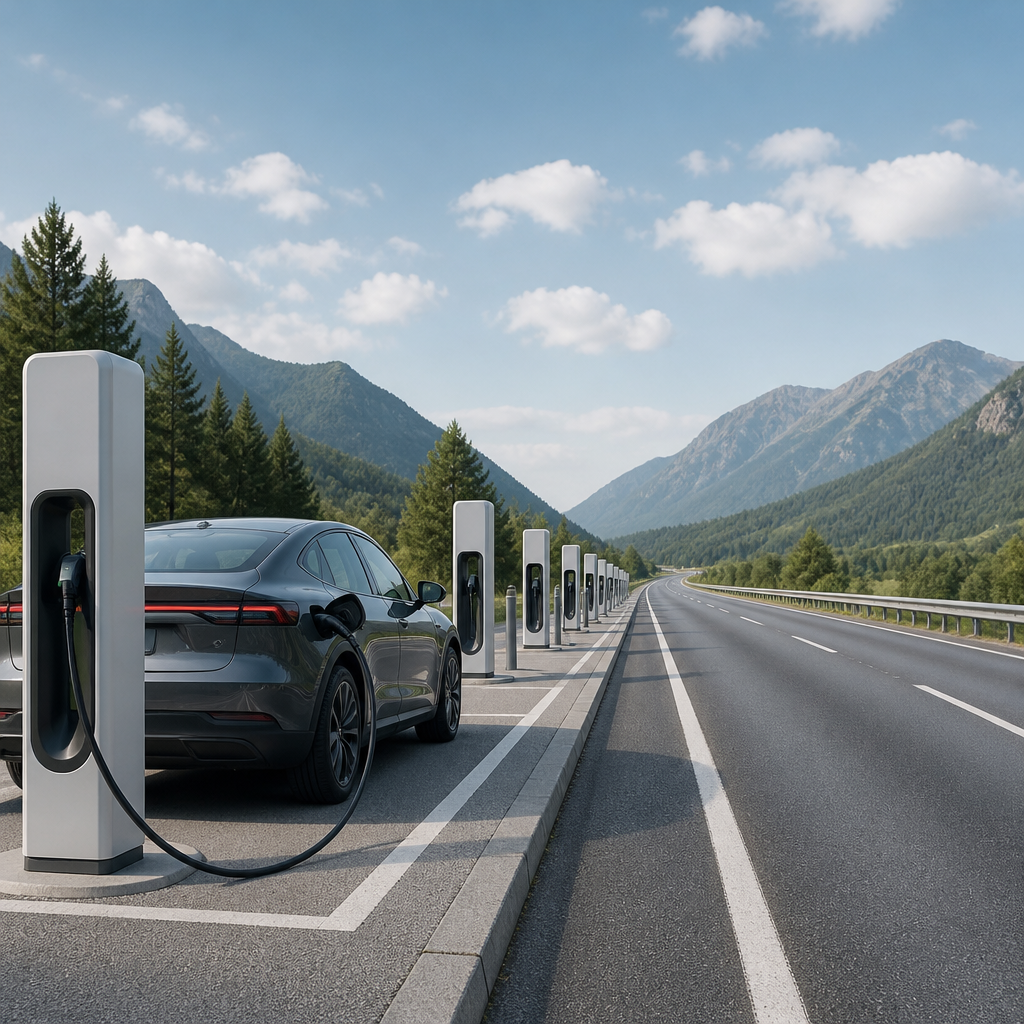
At 30,000 km, diesel energy costs about €2,888 (1,650 litres at €1.75). The EV on a home tariff draws 5,400 kWh for €1,620, a gap of roughly €1,270 a year. A €5,000 purchase premium would take just under four years to recover on that gap, and public-only charging reverses the saving.
Scenario at 60,000 km a Year
At 60,000 km, diesel energy costs about €5,775 (3,300 litres). The same EV on a home tariff costs €3,240 for 10,800 kWh, a gap of about €2,535 a year, which shortens recovery of a €5,000 premium to roughly two years. On public fast charging the EV costs about €6,480, still above the diesel for energy alone.
Pro tip: Before accepting a headline EV advantage, log the charging split for the first six months of ownership. The home share is the variable most likely to turn a favourable calculation into an unfavourable one.
Frequently Asked Questions
At what annual mileage does an EV usually beat a diesel on running cost?
There is no universal threshold, because the result depends on tariff and purchase premium. In the model above, the energy gap is about €1,270 a year at 30,000 km with home charging and widens with distance. Public-only charging at €0.60 per kWh reverses that advantage at the same mileage.
Is public fast charging cheaper than diesel for high-mileage driving?
Usually not. At €0.60 per kWh, an EV drawing 18 kWh per 100 km costs €10.80 per 100 km, above the €9.63 diesel baseline. Fast charging only makes financial sense when home charging is unavailable and the diesel consumption is worse than modelled.
Do high-mileage diesels still hold their resale value?
Resale depends on age, service history and local access rules. Heavily used diesels can face a narrower buyer pool in cities with low-emission restrictions, so check current local rules and comparable mileage-matched listings rather than assuming a value.
What should I check on a high-mileage used EV?
Request a measured battery state-of-health figure, the charging history if the seller has it, and records of any battery or thermal system service. Confirm the charging curve on a DC unit, since the reported peak power does not always match the rate a battery sustains.
How accurate are the inputs in an ownership cost calculator?
Accuracy depends on the inputs. Measured fuel receipts and a metered home tariff give a far better baseline than manufacturer combined figures or a generic national average, and every result should be rerun when the tariff or driving pattern changes.
Which running costs have you measured on your own high-mileage car, and did the figures match what you expected from the calculation?