WLTP Range Explained: Why Real-World EV Range Differs
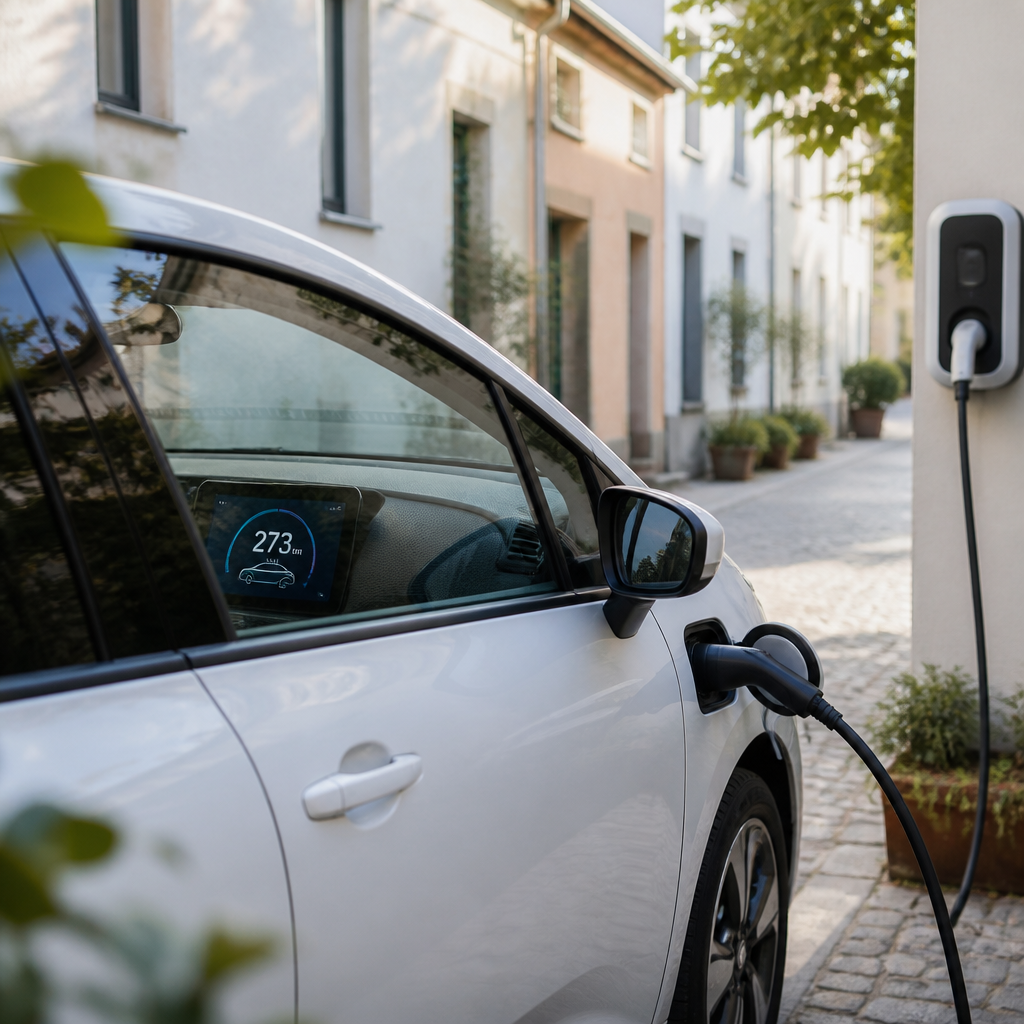
This guide on WLTP range explained covers what the number on an EV spec sheet actually measures, and why most drivers see less range on the road. The figure is useful, and every serious comparison relies on it. It is also produced under conditions that most people never repeat on a Tuesday commute. Understanding the gap is the difference between buying a car that fits your life and buying one that strands you at a motorway services with a flat battery.
Table of Contents
- Quick Takeaways
- What WLTP Actually Measures
- Why Real-World Range Falls Short
- Why Highway Speed Changes the Picture
- Temperature, Heating and Battery Condition
- Comparing Range Figures Side by Side
- What WLTP Means for UK and EU Buyers
- Planning Long Trips With Realistic Range
- Common Mistakes When Comparing Range
- Frequently Asked Questions
- References
Quick Takeaways
Key Insight
Explanation
WLTP is a controlled laboratory result
It gives you a standardised figure for ranking models, not a forecast for your specific trip.
A gap between WLTP and real range is normal
Independent highway testing has found some EVs falling up to 50 miles short of advertised range, while others beat it by a similar margin.
Motorway speed is the biggest swing factor
Energy use rises quickly at higher speeds, so a 100 mile WLTP figure can shrink fast on long UK or EU motorway runs.
Cold weather and heating reduce range
Battery efficiency drops in the cold, and cabin heating draws from the same pack that drives the wheels.
Compare consumption alongside range
A larger battery can produce a higher range figure while using more energy per mile, so check both numbers before deciding.
Your own logged average beats the brochure
Track consumption across several weeks of normal driving to get a planning figure that reflects your roads and passengers.
What WLTP Actually Measures
WLTP stands for the Worldwide Harmonised Light Vehicles Test Procedure. It is a standardised laboratory test in which a car is driven on a chassis dynamometer through a fixed sequence of speed phases, from slow urban running up to higher motorway speeds. Energy use is measured across the cycle and converted into the range figure you see on spec sheets and listing pages.
The value of that standardisation is comparison. Every manufacturer runs the same cycle, so you can line up two hatchbacks or two family SUVs and see which one uses less energy under identical conditions. Figures from older test cycles should not sit next to WLTP numbers, because the procedures differ and the results do not translate directly.
How the test cycle is run
In practice, the cycle is a tightly controlled exercise. The ambient temperature is managed, the car is loaded to a defined test mass, and the driver follows a speed trace on a screen. There is no wind, no hills, no traffic lights and no decision about whether to turn on the heater. That control makes the number repeatable, and it is also why the number is optimistic for most people.
What the headline number leaves out
The headline figure is a single value for one configuration. It does not tell you how the car behaves with four adults, a roof box, a wet motorway in November or a battery that has aged for several years. The wheel and battery combination you actually buy may differ from the one used in the advert, and that difference matters.
A lab figure answers the question "which car uses less energy under the same conditions?" It does not answer "will I reach the services on this motorway without a charge?"
Why Real-World Range Falls Short
Real-world range almost always comes in below the WLTP figure, and the reasons have nothing to do with a car being poorly built. The test removes the variables that cost energy on public roads. A plain-language explainer on WLTP range groups the gap into four areas: idealised conditions, driving behaviour, traffic and road conditions, and vehicle load.
Idealised conditions and missing variables
Lab conditions are steady and mild. Real roads bring gradients, crosswinds, poor surfaces and temperature swings, and each one pushes energy use away from the test result. The effect can go either way. A long downhill stretch recovers some energy through regenerative braking, which is why the same route can show different consumption in each direction.
Driving behaviour the cycle does not reward
A common mistake is assuming your driving matches the test. Hard acceleration from traffic lights, a heavy right foot on slip roads and cruising at the national limit all draw more energy than the gentle speed trace. Smooth, anticipatory driving can close part of the gap, but it rarely closes all of it on fast roads.
Load matters as well. Extra passengers, luggage on a roof rack and larger wheels all add energy demand. For a family that carries a pushchair, two adults and weekend bags, the lab figure is the best case, not the typical one.
Why Highway Speed Changes the Picture
Speed is the variable that matters most for most EV owners. Aerodynamic drag rises steeply as speed increases, so the energy needed to hold a motorway pace is far higher than the energy needed at town speeds. Independent highway testing confirms the pattern. Consumer testing of real highway range against advertised estimates found that some electric vehicles fell up to 50 miles short of their advertised ranges at highway speeds, while others exceeded theirs by the same amount.
The same testers noted that EVs, unlike conventional cars, tend to be less efficient on highways than in town. That reverses the usual intuition, and it is the most useful point to remember when you compare cars for long trips. Where you drive makes a significant difference, so a car that looks efficient on a city test may disappoint on a fast A-road.
Why the same car varies by route
Two cars can post identical WLTP figures and still behave differently on a 90 mile route that climbs into hills one way and returns across flat ground. Gradient, wind and speed limits all shift the result. A car with excellent low-speed efficiency may look strong on school runs but lose ground quickly on a long fast road.
Reading efficiency, not just range
The more useful number is energy use per distance, usually shown as consumption. Range is the outcome of battery size and consumption working together. A car with a large battery and high consumption can cover a similar distance to a smaller, more efficient car. When you compare models, check both figures so you know whether the range comes from efficiency or from carrying more battery.
Temperature, Heating and Battery Condition
Temperature is the factor that surprises new EV buyers most, especially in the UK and northern Europe, where winter mornings are often cold and wet. Batteries work less efficiently at low temperatures, and cabin heating draws energy from the same pack that drives the wheels. That combination can cut real range noticeably compared with a mild day in a test lab.
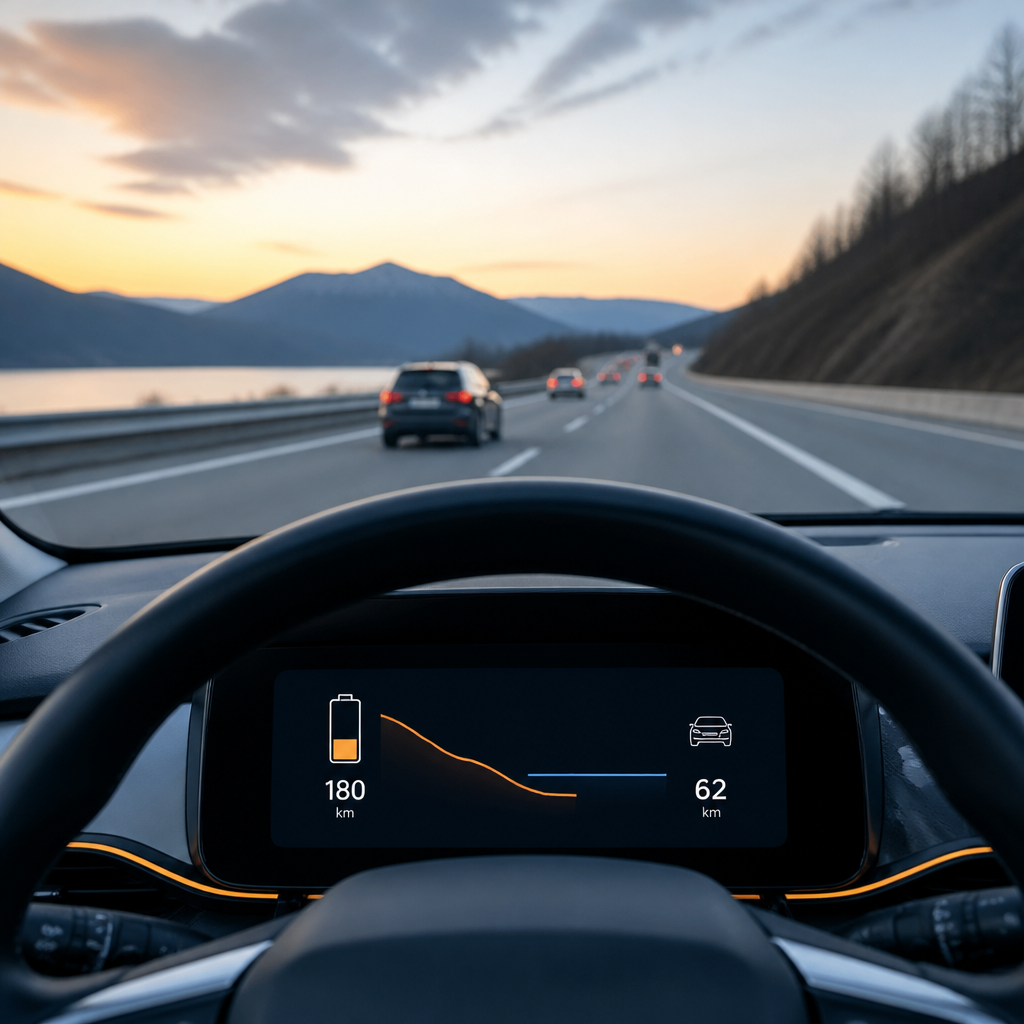
The most practical defence is pre-conditioning while the car is still plugged in. Warming the cabin and battery before you unplug draws power from the grid rather than from the battery. Many EVs let you schedule this through an app or the touchscreen, so check that the feature exists on the model you are considering.
Pro tip: Set your departure time in the car app the night before a cold commute. Pre-conditioning on a charger usually recovers more usable range than any driving technique you can adopt on the day.
Heat pumps and resistive heaters
Not every heating system behaves the same way. A heat pump can deliver warmth using less energy than a resistive heater, but it loses effectiveness in very cold conditions, so some cars combine both. When you read a range test, check whether heating was on and at what outside temperature. A figure from a mild spring day tells you little about a frosty February commute.
Battery age and state of health
Battery capacity declines gradually over years of use, and the rate depends on charging habits, climate and how often the pack sits at very high or very low charge. A used EV may show less range than the figure published when it was new. The UK Electric Car Grant guidance, for example, requires a warranty that provides for battery replacement if capacity falls below 70% during the first eight years, which is a useful benchmark when you judge a used car's likely health.
Comparing Range Figures Side by Side
No single number answers every question. The most useful approach is to use each figure for the job it does well. The table below sets out three common range measures, what each one captures and where it fits in a buying decision.
Range figure
What it measures
Best use
WLTP type-approval range
Energy use over a standard laboratory cycle with controlled conditions
Ranking models on equal terms and checking eligibility thresholds
Independent highway range test
Distance achieved at sustained motorway speeds until the battery is empty
Judging how a car performs on long trips and fast roads
Your logged average consumption
Energy used across your own journeys through changing seasons and loads
Planning your real weekly range and deciding whether the car fits your life
Use the WLTP figure as the starting filter. If a car falls short of the range you need, or its consumption is clearly higher than alternatives in the same class, drop it early. Do not treat the lab figure as the final answer. The highway test shows the long trip you will take occasionally, and your logged average shows the journeys you make every week.
Once a car reaches your shortlist, ask the seller for its consumption figure and compare it with the car you drive now. For combustion switchers, the useful question is how many miles of a typical winter week one charge covers, not whether the car hits its advertised figure in July.
What WLTP Means for UK and EU Buyers
For buyers in the UK and across Europe, WLTP is the figure you will meet first on most spec sheets. In the UK it also carries regulatory weight. The Electric Car Grant guidance lists a minimum battery range of 100 miles WLTP among its technical standards, so a car must clear that figure to be eligible.
The grant covers eligible electric cars registered in England, Scotland, Wales and Northern Ireland, and it applies to vehicles priced at £37,000 or below. The highest grant level, £3,750, goes to cars with the lowest carbon emission scores, and the second level is £1,500. Crown dependencies, including the Isle of Man, Jersey and Guernsey, are not included in the scheme.
Why the eligibility threshold is a floor
A 100 mile WLTP figure meets the grant's minimum, but it is not a comfortable real-world range for a household that drives motorways every week. Treat the threshold as a basic technical bar that a car must clear, not as a promise about how far it will go on your average trip.
Comparing listings across markets
Listings in different European countries may show the same WLTP figure alongside different equipment, battery sizes or wheel options. Compare the exact variant rather than the model name. Check which wheel size and battery pack the figure belongs to, because larger wheels can reduce range even when the badge is identical.
Pro tip: Save the WLTP figure for the exact variant you plan to buy, then compare it with the variant you can afford. Cheaper trims often carry a smaller battery or different wheels, and the headline number on the model page may not apply to them.
Planning Long Trips With Realistic Range
Trip planning is where the gap between WLTP and reality becomes costly. A driver who plans a long motorway journey using the headline figure with no margin may reach a charger with an empty battery, especially in poor weather or when the chargers are busy. The fix is to build a buffer into the plan before you set off.

Work backwards from your destination. Assume highway speeds and cold conditions if the trip falls in winter, and identify at least one backup charging point along the way. Navigation apps can show chargers, but confirm that a station is working and free before you rely on it.
Pro tip: Test your assumptions on a shorter run first. Drive a familiar route at motorway speed on a cold morning and note the percentage used per mile. That single number will tell you more than any brochure.
Charging stops and the arrival buffer
Plan charging stops for the point where the battery is still comfortable, not the point where it becomes urgent. Charging speed usually drops as the battery fills, so a longer stop at a higher charge level can cost more time than two shorter stops. Leave a reserve for arrival, because a charger that is out of order is far more common than a sudden change in weather.
Using the car's own trip data
Most EVs record consumption on the trip computer or in their app. Reset it at the start of each journey so you can compare your habits with the advertised figure. After a few weeks, you will have an average that reflects your roads, your weather and the people you usually carry.
Common Mistakes When Comparing Range
Most buyers who feel misled by range figures made one of a few predictable mistakes. Each one is easy to avoid once you know what to look for.
Treating the best-case number as typical
The highest range in a model line often belongs to the smallest wheels, the most efficient battery and the lightest specification. Choose a larger wheel or a heavier trim and the typical number drops. Check the variant, not the headline figure on the model page.
Mixing old and new test results
A range from an older cycle, a different test standard or an owner's forum post cannot be compared directly with a WLTP figure. Use one measure per comparison and label it clearly in your notes. Mixed numbers are the quickest way to pick the wrong car.
A second mistake is ignoring consumption in favour of range. A bigger battery can post a higher range figure while using more electricity per mile. Check both numbers, and you will see which car is genuinely efficient.
Range is not a fixed property of a car. It is the result of the car, the road, the weather and the driver working together.
Frequently Asked Questions
Is WLTP range the same as real-world range?
No. WLTP is a standardised laboratory result under controlled conditions. Real-world range depends on speed, temperature, load, route and driving style, so it is usually lower on motorways and in cold weather, although some cars beat their figures on gentle, mild trips.
Why does my EV show less range in winter?
Cold batteries work less efficiently, and cabin heating draws power from the same battery that drives the car. Pre-conditioning while plugged in and using seat heaters where available can reduce the impact on your range.
Is a higher WLTP number always the better car?
Not necessarily. A higher figure can come from a bigger battery paired with higher consumption. Compare consumption alongside range and check the exact variant you intend to buy.
Can I compare WLTP figures with older range ratings?
Avoid direct comparisons. Different test procedures produce different results, so use one standard per comparison and check how each figure was measured before you decide.
How do I measure my own real-world range?
Reset the trip computer after each full charge, drive your normal routes for several weeks and record the average consumption. Note the temperature, the roads you used and the number of passengers, because those details explain most of the variation.
Does the UK Electric Car Grant depend on WLTP range?
Yes. The guidance sets a minimum battery range of 100 miles WLTP as one of its technical standards, alongside other conditions such as the vehicle price ceiling of £37,000 or below.
Tell us how close your real-world range came to the WLTP figure on your last long journey, and what the weather and motorway speeds were like.