WLTP vs Real-World EV Range: How Much Do You Lose?
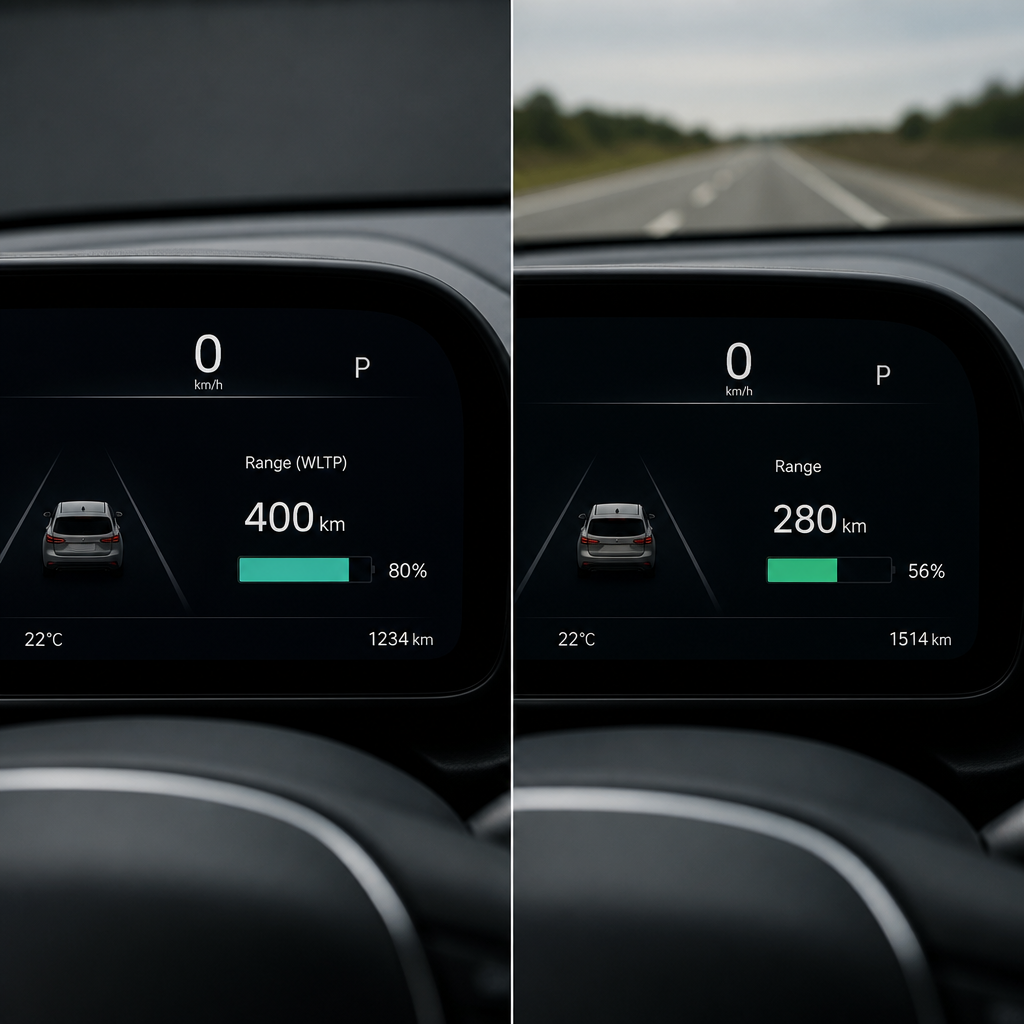
You find an electric vehicle with a claimed WLTP range of 400 km, plan a 350 km road trip, and then watch the battery indicator collapse somewhere around the 280 km mark. This is not a fault with your car. It is a predictable gap between laboratory conditions and real life, and it catches first-time EV buyers by surprise more than almost any other factor. Understanding the WLTP vs real-world range difference is one of the most practical things you can do before committing to any EV, and it is exactly the kind of data that makes a proper ev compare exercise worth doing before you sign anything.
Table of Contents
- What Is WLTP and What Does It Actually Test?
- Quick Takeaways
- How Big Is the Real-World Range Gap?
- The Factors That Reduce EV Range Below WLTP
- WLTP vs Real-World Range: A Direct Comparison
- How to Use WLTP Figures Correctly When Comparing EVs
- Frequently Asked Questions
- References
What Is WLTP and What Does It Actually Test?
WLTP stands for Worldwide Harmonised Light Vehicle Test Procedure. It replaced the older and heavily criticised NEDC (New European Driving Cycle) standard and became mandatory for new vehicles sold across the EU and UK. The intention was to produce a more realistic and comparable number than its predecessor, and in some respects it succeeded. In other respects, the gap between the lab and the road remains significant.
The WLTP cycle runs entirely in a laboratory on a dynamometer. The test is conducted at a fixed temperature of 23°C. The heating and air conditioning systems are switched off. The average speed across the full cycle is approximately 46.5 km/h, with a maximum speed of 131 km/h reached only briefly. The test is divided into four phases: low, medium, high, and extra high speed, each containing sub-phases of acceleration, cruising, braking, and stopping.
What the test does not replicate is the actual variety of European driving. A German motorist cruising the Autobahn at 130 km/h for two hours, a British commuter sitting in stop-start traffic with the heater running in February, or a driver in Norway at -10°C will all experience conditions that sit well outside what the WLTP lab captures. The test produces a defensible benchmark, not a driving guarantee.
One additional detail matters for EV buyers specifically: the WLTP figure is measured using the vehicle's full usable battery capacity. In real use, most EVs do not let you discharge fully to zero, and most experienced EV drivers keep a comfort buffer at the bottom of the battery for safety. That buffer quietly eats into the headline range before you even factor in weather or speed.
Quick Takeaways
Key Insight
Explanation
WLTP is a lab baseline, not a road guarantee
The test runs at 23°C with no climate control and an average speed well below typical motorway cruising. Real driving diverges from every one of those conditions.
Most EVs return 70 to 80 percent of WLTP in mixed driving
In mixed UK and European driving, independent tests consistently show real-world range coming in at around 70 to 80 percent of the official WLTP figure.
Motorway speeds hit range hardest
At a sustained 110 to 130 km/h, aerodynamic drag increases sharply. Real-world range at motorway speeds can drop to 65 to 75 percent of WLTP.
Cold weather causes the steepest drops
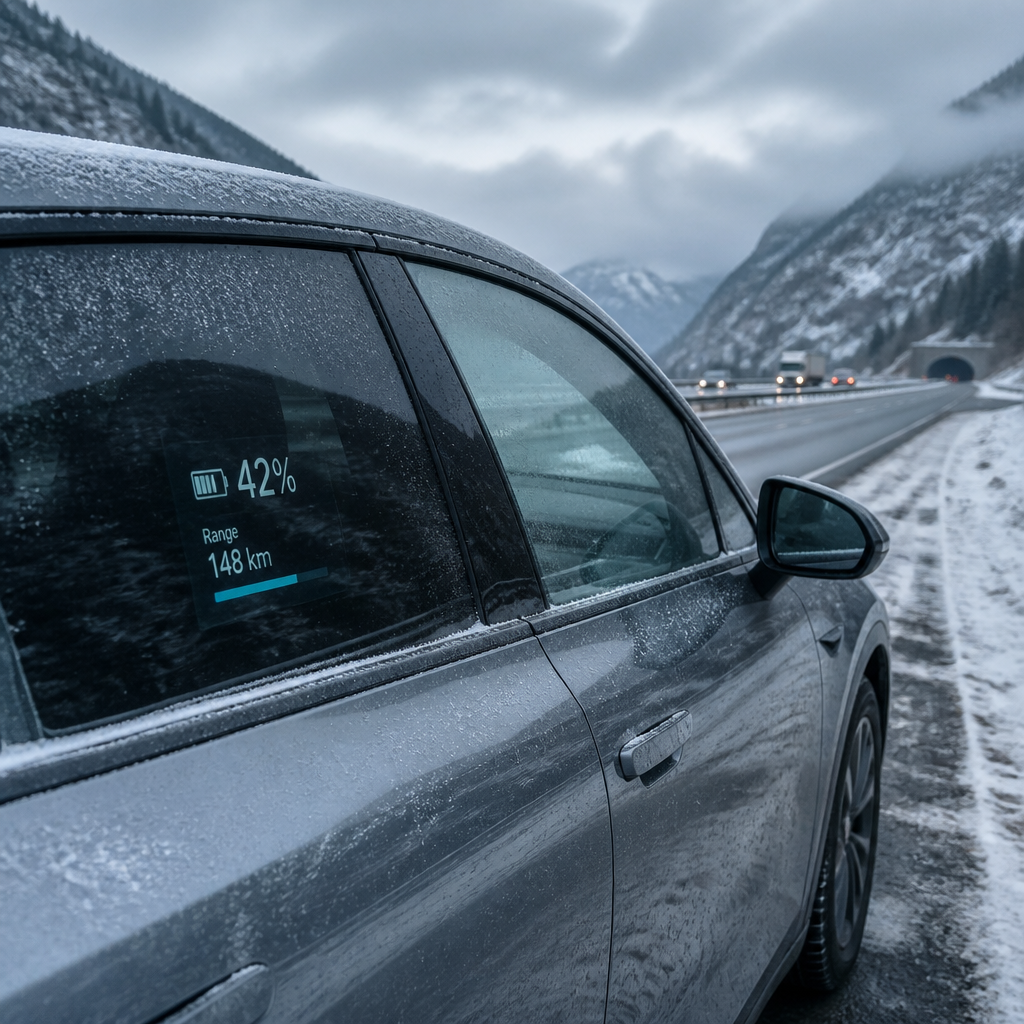
At temperatures between 0°C and -10°C, real-world EV range can fall 10 to 23 percent below the WLTP figure, with cabin heating making the loss worse.
Gaps between brands vary widely
Independent European road tests have recorded WLTP shortfalls ranging from 16 percent to over 40 percent depending on model and conditions. Brand choice matters.
City driving often beats WLTP
In slow urban traffic, regenerative braking recovers substantial energy. Some EVs actually approach or match WLTP figures in genuine low-speed city conditions.
Comparing EVs on WLTP alone misleads you
Because the gap between WLTP and real world varies by model, two EVs with the same WLTP figure can deliver very different real-world ranges. Always check real-world data when you ev compare.
How Big Is the Real-World Range Gap?
The short answer is: bigger than most people expect, and more variable than manufacturers suggest. Independent testing across Europe consistently shows that real-world range falls short of the official WLTP figure across every model tested. The question is not whether there is a gap, but how large that gap is for the specific vehicle you are evaluating.
In mixed UK and European driving, most electric cars return around 70 to 80 percent of their official WLTP figure. At a sustained motorway speed of around 110 to 115 km/h, that drops to roughly 65 to 75 percent. In a cold winter with the heater running, some cars deliver as little as 60 percent of the claimed number. That means an EV rated at 400 km WLTP might realistically deliver 280 to 320 km on a typical mixed journey, and closer to 260 to 300 km on a winter motorway run.
A major European real-world road test covering multiple models found WLTP shortfalls ranging from 16 percent at the best end to over 40 percent at the worst end. Among specific results from independent testing, the Tesla Model 3 and BMW i5 performed at the more efficient end of the spectrum, while some SUV models registered significantly larger gaps. A Norwegian winter test, which is one of the most rigorous real-world validation exercises conducted annually, found that the worst performers fell over 20 percent below their WLTP claims even for models designed and marketed for cold climates.
The common mistake is to treat WLTP as a reliable journey-planning figure. It is not. It is a comparison tool, and using it as an absolute range estimate leads directly to anxiety and disappointment on longer trips.
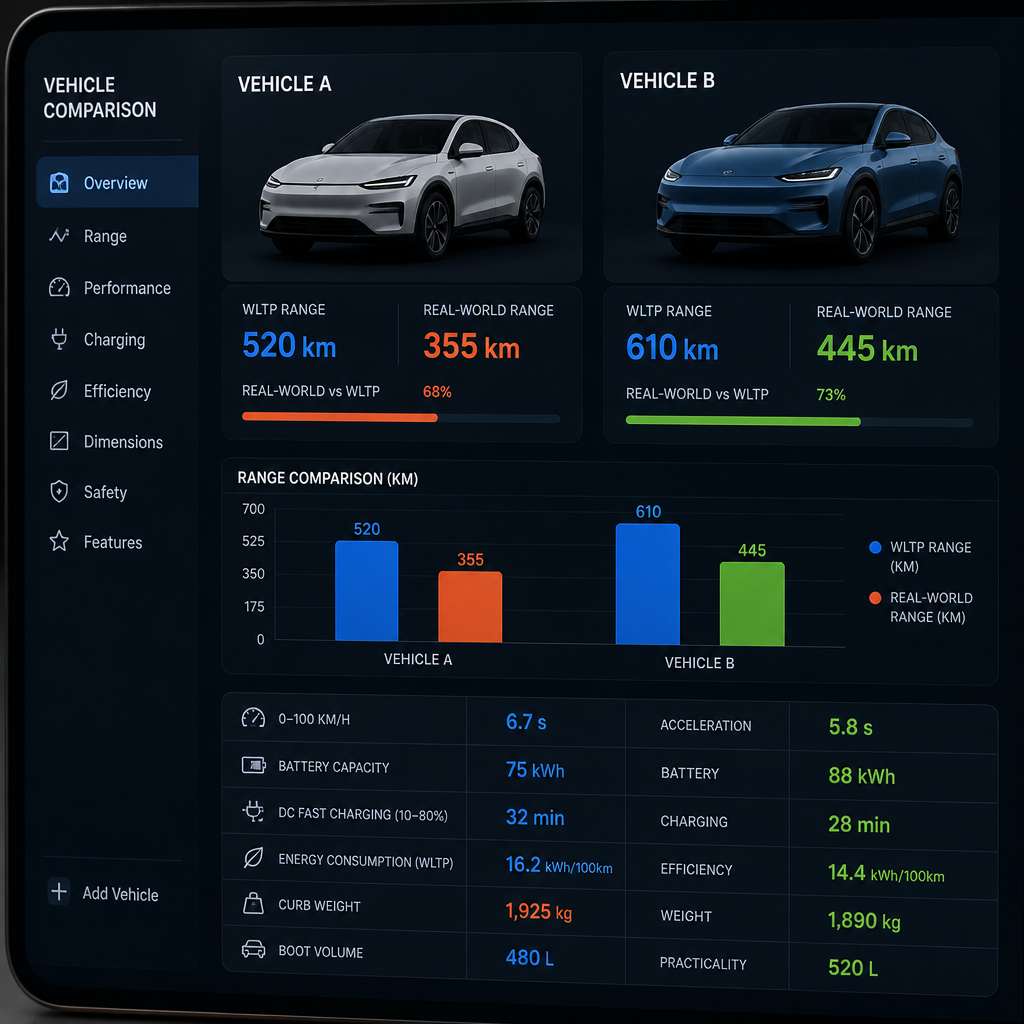
This matters enormously when you ev compare two models that look equivalent on paper. If Model A delivers 78 percent of its WLTP figure and Model B delivers 62 percent, the car with the lower official rating might actually take you further on a real motorway journey. WLTP figures make like-for-like comparisons possible. They do not tell you what you will actually experience in the driver's seat.
The Factors That Reduce EV Range Below WLTP
Speed and Aerodynamic Drag
Aerodynamic drag increases with the square of velocity. The WLTP test averages a speed well below typical motorway cruising, so its energy consumption figures look very generous once you are travelling at 110 to 130 km/h for an extended period. This is the single most predictable source of real-world shortfall, and it is entirely physics-based rather than a manufacturer error. Every extra 10 km/h above the test's effective average speed costs energy at a non-linear rate.
Pro tip: If most of your driving is urban commuting with speeds under 60 km/h, you will often come closer to WLTP figures than motorway drivers will. Regenerative braking in city traffic genuinely recovers meaningful energy. Plan your purchase around your actual driving profile, not the worst case or the best case.
Temperature and Climate Control
Cold weather is one of the most aggressive range reducers for EVs. Battery chemistry becomes less efficient at low temperatures, and the energy demand from cabin heating is substantial. In Norwegian winter test conditions between 0°C and -10°C, real-world EV range was found to be 10 to 23 percent lower than the WLTP figure across tested models. The WLTP lab test is conducted at a fixed 23°C with climate control switched off, so neither of those factors appears in the official number at all.
Summer heat brings its own costs. Air conditioning load places demand on the battery, though the effect is typically less severe than winter heating. Some vehicles manage thermal conditions more efficiently than others, which is one reason that real-world range efficiency varies so much by brand even when WLTP figures look similar.
Vehicle Load and Driving Style
A full car with luggage weighs more than the test configuration, and heavier vehicles consume more energy at every speed. Aggressive acceleration, which the WLTP test does not replicate in its smoothed phases, depletes the battery faster than gentle driving. These factors compound each other on long family trips, where you are carrying weight, using climate control, and likely covering some motorway distance.
Pro tip: When using a real-world range analysis tool to plan a long trip across Europe, apply a conservative multiplier of around 75 to 80 percent of the WLTP figure for mixed driving, or 65 to 70 percent for sustained motorway routes. This buffer is not pessimism. It is the practical correction that makes range anxiety disappear.
WLTP vs Real-World Range: A Direct Comparison
The table below compares three approaches to how EV range figures are generated and used, so you can understand what each number actually tells you before you ev compare models side by side.
Range Measurement Type
Conditions
Practical Use for Buyers
WLTP (Official)
Laboratory dynamometer, 23°C fixed temperature, no climate control, average speed approx. 46.5 km/h, full usable battery
Useful for comparing models against each other on a level playing field. Not suitable as a planning figure for real journeys.
Independent Real-World Test (e.g. ADAC, Norwegian winter test, press road tests)
Real roads, variable temperatures, realistic speeds, climate control in use. Results published by third-party organisations.
Far more useful for understanding what to expect on a specific type of journey. Best for motorway or cold-climate planning. Results vary by test organisation and conditions.
Owner Real-World Data (aggregated community or platform data)
Accumulated from real drivers across varied conditions, seasons, and driving styles. Reflects the actual ownership experience of a specific model.
Most representative of everyday use. Accounts for vehicle age, software updates, charging habits, and seasonal variation. This is the data that genuinely informs a purchase decision.
The key point from this comparison is that no single number captures every situation. A buyer doing a daily 40 km urban commute and a buyer planning regular 500 km inter-city motorway journeys need to weight these figures very differently. A platform that provides real-world range analysis alongside WLTP data, and lets you compare EV models directly against each other and against ICE alternatives, closes the gap between official claims and real ownership experience.
How to Use WLTP Figures Correctly When Comparing EVs
The WLTP figure is not useless. Its value is in comparison, not prediction. When you ev compare two vehicles using their WLTP numbers, you are working with figures generated under identical conditions. That means differences between the figures reflect genuine differences in vehicle efficiency and battery capacity, rather than differences in how a manufacturer chose to test or report the car.
Use WLTP to Filter, Then Real-World Data to Decide
A good two-stage process is to use WLTP range to create a shortlist of vehicles that could plausibly meet your needs, then use real-world range data to evaluate which of those vehicles actually delivers in practice. If your commute and occasional longer trip requires around 250 km of usable range in winter conditions, you need to be looking at vehicles with WLTP figures well above that, because the cold-weather real-world figure will be significantly lower than the lab number.
For most EU and UK buyers, a WLTP figure of at least 350 to 400 km provides a practical real-world buffer for mixed use including occasional motorway runs. Vehicles with WLTP figures below 300 km require careful evaluation of whether their real-world performance covers your regular routes with enough margin for comfort.
Look at the WLTP-to-Real Efficiency Ratio, Not Just the WLTP Number
This is where a proper side-by-side comparison tool earns its value. Two vehicles might both show a WLTP figure of 400 km. If independent testing shows one delivers 78 percent of that figure and the other delivers 61 percent, the practical difference on a winter motorway journey is the difference between a comfortable 290 km and a stressful 240 km. That is a decision-changing gap, and it is invisible if you look only at the WLTP figure on a manufacturer's website.
The Wise EV comparison platform provides real-world range data alongside official figures, so you can see exactly how each model performs across different conditions rather than relying on a single lab number. Running a side-by-side EV comparison before you finalise a shortlist is the most direct way to cut through marketing claims and compare what you will actually experience over the ownership period.
Factor in Your Specific European Climate
The WLTP gap is not uniform across Europe. A buyer in southern Spain will experience conditions far closer to the WLTP test environment than a buyer in Scotland or Scandinavia. The cold-weather range loss of 10 to 23 percent documented in Norwegian winter conditions applies specifically to cold climates, not to all regions year-round. When you evaluate real-world range data, pay attention to whether the test conditions reflect your climate, not just an average European condition.
Frequently Asked Questions
What does WLTP stand for and why does it matter for EV buyers?
WLTP stands for Worldwide Harmonised Light Vehicle Test Procedure. It is the standardised test used across the EU and UK to measure the range and efficiency of new vehicles. It matters because every range figure you see on an EV listing, manufacturer website, or comparison sheet is based on this test. Understanding what the test does and does not measure helps you convert that figure into a realistic expectation for your own driving.
How much range do EVs typically lose compared to their WLTP figure?
In mixed real-world driving across the EU and UK, most EVs return around 70 to 80 percent of their official WLTP range. At sustained motorway speeds, this can fall to 65 to 75 percent. In cold winter conditions with cabin heating in use, some models deliver as little as 60 percent of the WLTP number. The exact shortfall varies significantly by model, with independent European road tests recording gaps between around 16 and over 40 percent depending on the vehicle and conditions.
Does cold weather really make a significant difference to EV range?
Yes, and it is one of the most underestimated factors for buyers in northern and central Europe. Cold temperatures reduce battery efficiency, and the energy needed to heat the cabin comes directly from the drive battery. In winter test conditions between 0°C and -10°C, real-world range has been recorded at 10 to 23 percent below WLTP. For buyers in the UK, Germany, the Nordics, or other colder EU regions, this seasonal variation should be part of every purchase evaluation.
Is it ever possible to match or beat the WLTP figure in real life?
In genuine low-speed urban driving, especially in moderate temperatures, some EVs can come close to or occasionally match their WLTP figure. Regenerative braking in stop-start city traffic recovers substantial energy that laboratory testing does partially capture in its urban phase. However, most real-world driving mixes urban and higher-speed segments, so matching the headline figure over a full journey is uncommon. The WLTP figure is best understood as an upper bound for most practical purposes.
How should I use WLTP figures when comparing two EV models?
Use WLTP figures for like-for-like comparison between models, not as a promise of actual range. Two cars tested under the same WLTP conditions can be meaningfully compared using those figures. The more important step is to then check independent real-world testing data for both models, because the ratio of real-world range to WLTP varies substantially between vehicles. A car with a slightly lower WLTP number but a better real-world efficiency ratio can deliver more usable range in practice than a car with a higher official figure.
Can I trust the ownership cost savings calculation if range figures are inflated?
The range figure affects how you plan journeys and charge, but cost savings comparisons between EVs and ICE vehicles are less sensitive to this gap than many buyers assume. Energy cost per kilometre is calculated from real-world consumption, not WLTP range. The meaningful figures for ownership cost comparison are the actual electricity cost per km and the actual fuel cost per km, both of which are grounded in real-world consumption data rather than lab test range. When evaluating total cost of ownership, focus on per-kilometre energy costs and depreciation data rather than treating WLTP range as a direct input to the calculation.
Why do some EVs have a smaller gap between WLTP and real-world range than others?
Several factors determine how efficiently a vehicle manages energy outside controlled conditions. Aerodynamic design affects high-speed efficiency. Battery thermal management determines how well the vehicle maintains performance in cold or hot conditions. Software optimisation of the drivetrain and regenerative braking affects how much energy is recovered in urban driving. Some brands have historically engineered their vehicles to perform well in real-world conditions even when that comes at the cost of a slightly lower headline WLTP figure. This is exactly the kind of comparison that a detailed side-by-side evaluation tool makes visible.
Have you experienced a significant gap between the WLTP range and what your EV actually delivers in everyday driving? Share your experience in the comments below.
References
- Why WLTP figures consistently understate real-world EV range, with model-by-model data from independent testing
- How WLTP range compares to real-world performance in UK and European driving conditions
- How to calculate actual EV driving distance from official WLTP figures
- WLTP explained: what the test measures, what it misses, and how cold weather changes everything
- Results from the Norwegian winter EV range test showing real-world losses across popular European models