WLTP vs Real Range: The Gap, by Model and by Speed
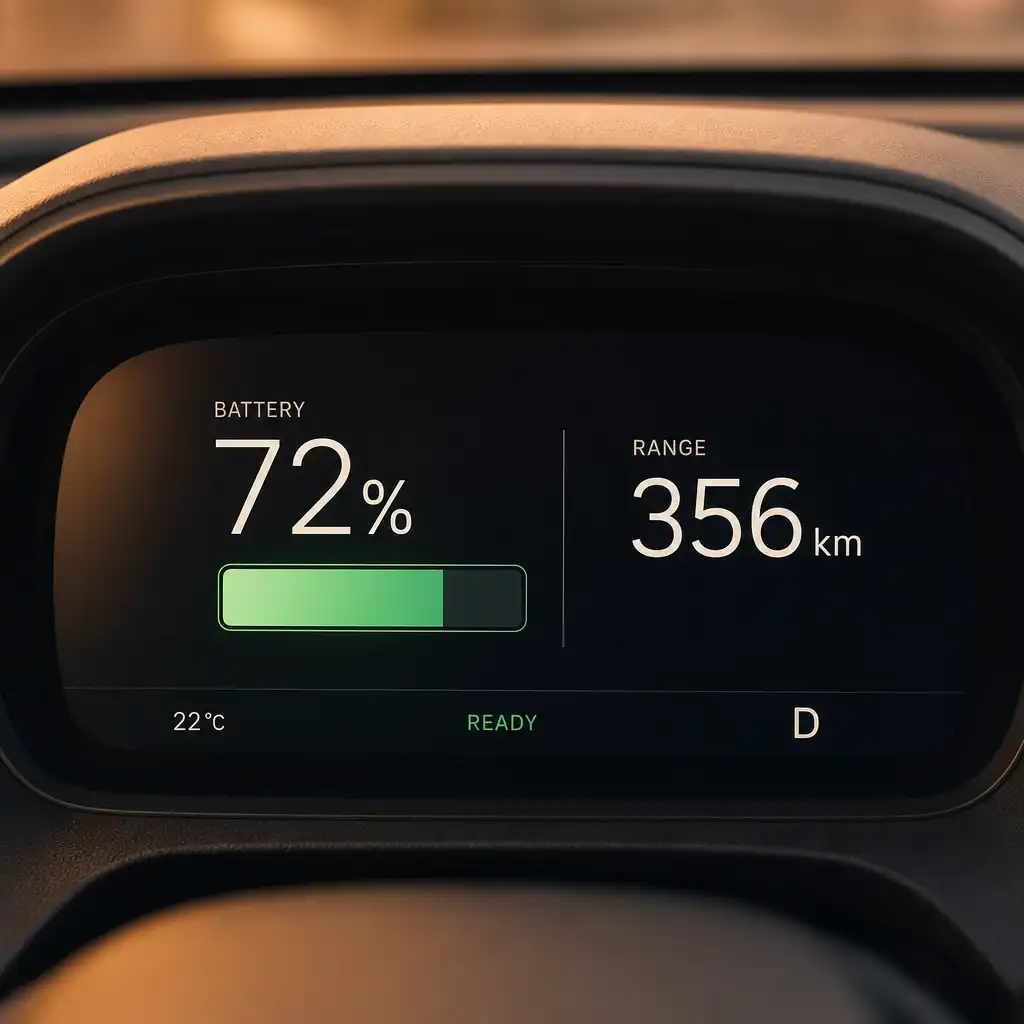
Your brochure says 439 km. The motorway sign says 70. Somewhere between those two numbers is the one you actually get, and the gap is wider than most first-time buyers expect.
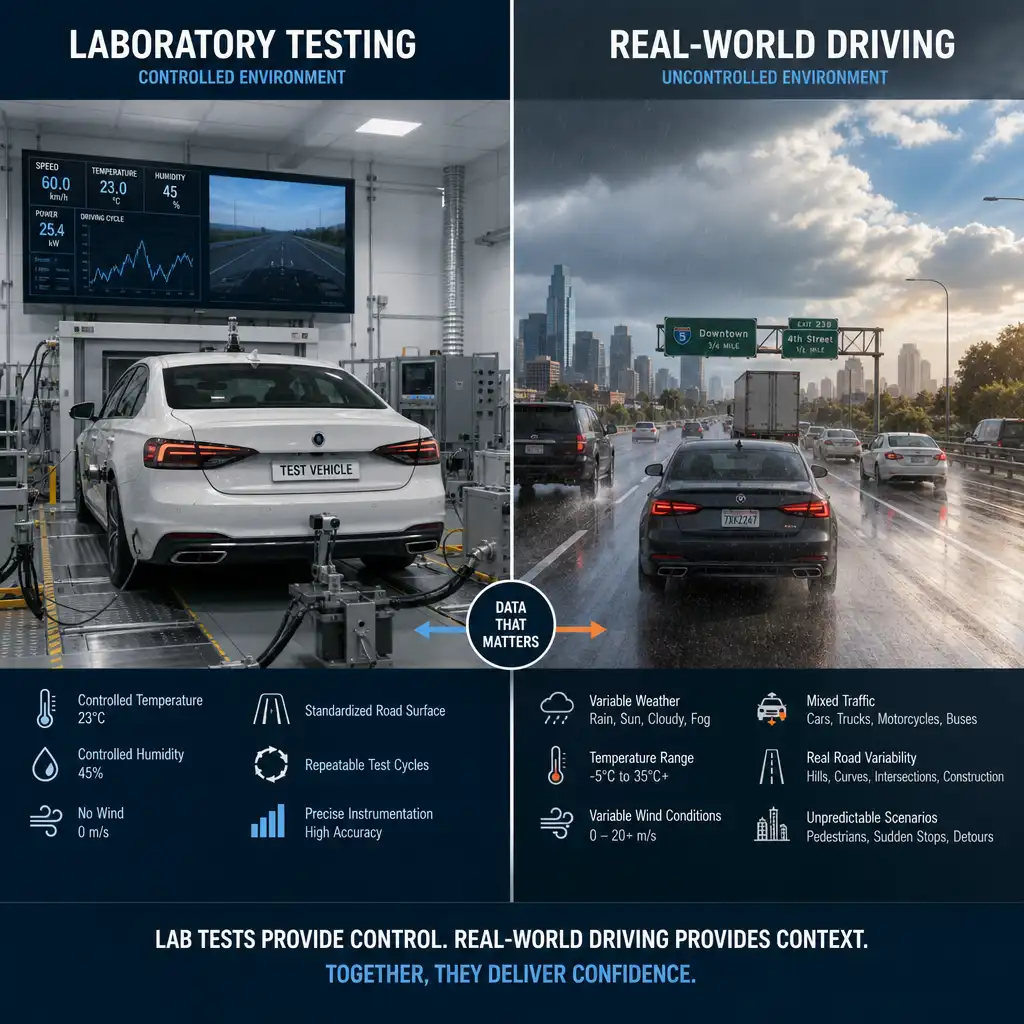
Here is the thing worth knowing before you shop. The official range figure comes from a laboratory test that lasts 30 minutes, covers 23 km, and averages 46.5 km/h. It spends three minutes above 100 km/h and about seven seconds at or above 130. British motorway traffic averages 68 mph, which is roughly two and a half times the pace of the test that produced the number on the window sticker.
That is the whole story. Not a scandal, not a manufacturer trick, just a lab and a road measuring different things.
Contents
- What you actually get, by speed
- What the WLTP number really measures
- Why it is not a manufacturer trick
- The measured gap, by model and by speed
- What this means at British motorway speeds
- Cold is worse, and that is a different problem
- How to work out your own number
- FAQ
- References
What you actually get, by speed
Five ordinary electric cars, one magazine test, one warm day each, driven at a steady speed until the battery ran down.
| Car | Brochure | At 100 km/h | At 130 km/h |
|---|---|---|---|
| Skoda Enyaq iV 60 | 395 km | 363 km (92%) | 278 km (70%) |
| Hyundai Ioniq 5 77.4 RWD | 507 km | 474 km (94%) | 332 km (66%) |
| Fiat 500e 37.3 kWh | 321 km | 279 km (87%) | 218 km (68%) |
| BMW iX1 xDrive30 | 439 km | 366 km (83%) | 334 km (76%) |
| Mercedes EQB 300 4Matic | 421 km | 371 km (88%) | 280 km (67%) |
| Average | 89% | 69% |
At a steady 130 km/h these cars did about two thirds of their brochure range. At 100 km/h, about nine tenths. Ambient temperature was 21 to 25 degrees on every run, so none of this is a winter effect.
What the WLTP number really measures
WLTP replaced the old NEDC test in 2017. It is a better test. It is still a laboratory.
The cycle runs for 1,800 seconds and covers 23,266 metres in four phases, with speed ceilings of 56.5, 76.6, 97.4 and finally 131.3 km/h. Counted second by second from the regulation's own speed trace: 182 seconds above 100 km/h, and seven seconds at or above 130. The average across the whole thing is 46.5 km/h, which is the pace of a busy ring road.
Three more things about the car that produced your number.
The lab is set to 23 degrees and nothing in the car is switched on. The regulation sets a temperature set point of 23 degrees, with a tolerance of plus or minus 5, and says auxiliary devices "shall be switched off or deactivated" unless the law requires them. No heater. No air conditioning. No radio.
There is a colder European test, and it is not allowed to touch electric range. A 14 degree correction test exists, and it applies to petrol and diesel CO2 figures and to plug-in hybrids. For a pure electric car the regulation says plainly: "No correction is required for an Electric Range."
And for almost every modern EV, the car never drives the distance on the sticker. If the estimated range is more than about 70 km, which covers essentially everything on sale, the lab uses a shortened procedure. The car drives two segments at ordinary speeds to measure how much energy it uses, then sits at 100 km/h or more purely to flatten the battery. The declared range is the whole usable battery divided by the consumption measured over the slow segments. The fast part empties the pack and measures what was in it. It is never allowed to raise the consumption figure that the range gets divided by.
Which is exactly why the number falls apart on a motorway. It was never a motorway number.
Why it is not a manufacturer trick
This is the part most articles get backwards, so it is worth being clear.
A carmaker is not allowed to claim a range better than the lab measured. The regulation sets the acceptance test for a pure electric car at declared range multiplied by 1.0, with no tolerance at all, and the same zero tolerance applies to the consumption figure. Compare that with CO2 for a petrol car, which gets a tolerance ladder of 0.990, 0.995 and 1.000. And when a manufacturer re-declares, the regulation permits electric range to be revised downward only.
So the incentive runs the opposite way to the folk theory. Failing a type-approval test costs money, so the safe move is to declare conservatively and pass first time. Within the lab's own frame of reference, the brochure figure is a number the manufacturer picked that the lab was then able to beat.
What that does not tell you is whether the lab's frame of reference looks anything like your Tuesday. It does not.
One more thing worth knowing, because it trips people up. The consumption figure in kWh/100 km is measured at the wall socket, not at the battery. The meter sits "between the vehicle charger and the mains", so charging losses are already inside it, modelled at around 12%. The range figure, though, is calculated from energy drawn out of the battery. The two published numbers are measured on opposite sides of the charger, which is why multiplying them does not give you your battery's usable capacity. Green NCAP put it neatly: people who divide the quoted battery capacity by the quoted consumption "often obtain a different value for the range than is stated there".
The measured gap, by model and by speed
The cleanest speed measurement available comes from Green NCAP, because they run the same car in the same lab on the same instruments, warm at 23 degrees and again on a motorway cycle at 23 degrees. Same temperature both sides, so the only thing that changes is speed and load.
Across sixteen electric cars, the motorway cycle raised energy consumption by a median of 48%, ranging from about a third more to two thirds more. Eleven of the sixteen are shown here.
| Car | Warm cycle | Motorway cycle | Extra energy |
|---|---|---|---|
| Tesla Model 3 RWD (2024) | 14.8 | 20.8 | +41% |
| VW ID.3 Pro | 16.9 | 23.8 | +41% |
| Fiat 500e 87 kW | 17.8 | 25.5 | +43% |
| Hyundai Kona 39.2 kWh | 18.9 | 27.2 | +44% |
| Kia EV6 239 kW AWD | 19.8 | 29.1 | +47% |
| Skoda Enyaq 85 | 17.4 | 25.9 | +49% |
| Nissan Leaf e+ | 19.1 | 28.9 | +51% |
| Toyota bZ4X 150 kW | 16.9 | 26.1 | +54% |
| MG 4 Comfort | 16.4 | 26.2 | +60% |
| Hyundai Ioniq 5 58 kWh | 18.5 | 30.2 | +63% |
| Renault Zoe R110 | 17.9 | 29.8 | +66% |
All figures kWh/100 km, and these include charging losses.
Watch the arithmetic here, because it is easy to get backwards. Using 48% more energy is not losing 48% of your range. It is 1 divided by 1.48, so you keep about 68% of the distance. Roughly a third less, which lines up with the two thirds in the first table.
Two caveats worth stating. Green NCAP's motorway cycle averages about 133 km/h and includes full-throttle accelerations from 80 to 130, so it is harsher than steady cruising. And that 48% is measured against the same car's own warm lab cycle, not against its brochure figure. Against the declared number the gap is wider still.
The physics behind it is not complicated. Type approval models the resistance a car pushes against as a curve with three terms, and the aerodynamic one rises with the square of speed. Power is force times speed, so the power needed to push air out of the way rises with the cube. Double your speed and you are not doing twice the work.
And it cuts both ways. In a separate set of runs by Bjørn Nyland, published through the zerofy.net database, a Hyundai Kona Electric held at a steady 90 km/h covered 510 km against a 470 km brochure figure. Those tests do not publish their conditions, so treat the exact number with care, but the direction is clear enough: drive slower than the test and you can beat the number.
What this means at British motorway speeds
The UK limit is 70 mph. What people actually do is close to it: the Department for Transport measured an average free-flow speed for cars on motorways of 68 mph in 2024, with 44% exceeding the limit and 7% going more than 10 mph over.
So a British motorway cruise sits at roughly 109 km/h. That is between the two columns in the first table, closer to the 100 km/h figure than the 130 one. Expect something in the region of 80 to 85% of the brochure range on a steady motorway run in mild weather, rather than the two thirds you would see at a continental 130.
That has a practical consequence for anyone cross-shopping. British drivers see a smaller WLTP gap than German, French or Spanish drivers do, simply because the national speed limit is lower. A used EV imported into a Dutch or British context will do better on the motorway than the same car in Germany, and nothing about the car has changed.
It also means the brochure figure is least useful exactly when you care most. Your commute and the school run will comfortably beat the official number in summer. The 300 mile drive to see family in August is where it falls short, and that is the trip people buy range for.
If you are comparing specific cars on this basis, our comparison tool puts real consumption and running costs side by side rather than repeating the brochure figure.
Cold is worse, and that is a different problem
It would be convenient to tell you speed is the biggest thing standing between you and your brochure range. The measurements do not support it.
The same sixteen Green NCAP cars, tested at minus 7 degrees, used a median of 72% more energy than on the warm cycle, against 48% for the motorway cycle. Cold beat speed on fifteen of the sixteen. The only exception was the Renault Zoe.
Green NCAP also publishes what that does to distance. These are their own estimated ranges rather than brochure figures, so read them as warm against cold, not as a share of what the advert promised.
| Car | Warm, mixed | Warm, motorway | Cold, mixed | Cold, motorway |
|---|---|---|---|---|
| Dacia Spring 27.6 kWh | 180 km | 133 km (74%) | 119 km (66%) | |
| Hyundai Inster 49.0 kWh | 322 km | 267 km (83%) | 219 km (68%) | 199 km (62%) |
| VW ID.4 Pure 52.0 kWh | 304 km | 196 km (65%) | 193 km (63%) |
The Inster is the only one of the three with all four numbers, and it separates the two effects. Speed alone costs it 17% of its range. Cold alone costs 32%, about double. Both together cost 38%, which is less than stacking the two effects would suggest. Cold and speed do not simply add up.
So in round numbers: a winter journey leaves you roughly two thirds to three quarters of your warm-weather range, and a winter motorway journey leaves you around 62 to 66%. That is the number to plan the February trip around.
Two things stop that being the whole picture. The cold test is a short, town-heavy cycle from a cold start, with the heater working hardest on a cold cabin and a cold battery, so it is a worst case rather than an average winter day. And on a long drive the cold penalty fades as the car warms up, while the speed penalty does not fade at all.
Winter range deserves more than a paragraph, and we have given it one: see how much range EVs really lose in winter, model by model.
How to work out your own number
- Start with the motorway figure, not the combined one. If a source publishes a separate motorway or highway number for the car, that is the one that decides whether a long trip works. The combined WLTP figure is mostly town driving.
- Apply a speed correction from the table above. About 90% at 100 km/h, about 80 to 85% at British motorway speeds, about two thirds at a steady 130. Then take off more for winter.
- Do not compare an EV's official range with a diesel's real tank range. You have been reading your diesel's actual behaviour for years and its brochure figure for none of them. Compare like with like: brochure against brochure, or real against real.
- Check the consumption figure, not just the range. A big battery with poor aerodynamics and a small battery with good aerodynamics can quote the same range and behave completely differently at 70 mph.
- Work out what you actually drive. If your longest regular trip is 40 miles, almost any modern EV clears it in any weather, and charging speed matters more to you than range. If you do 200 miles of motorway a month, the motorway figure is the only number that matters.
- Remember the battery ages. A car a few years old will not hold quite what it held new, which sits on top of everything above. Our guide to used EV battery health covers what to check and what to ask for.
FAQ
How much less than WLTP should I expect in normal driving? In mixed driving in mild weather, roughly 10 to 15% below the official figure. On a steady motorway run at British speeds, roughly 15 to 20% below. At a continental 130 km/h, about a third below. In winter, more again.
Is the official range figure misleading? No, and the regulation makes it hard to be. A manufacturer cannot declare a range higher than the lab measured, with no tolerance, and may only revise it downward. The figure is accurate about a test that does not resemble your driving.
Why does my car's own display disagree with both? Most cars estimate remaining range from your recent driving, so it follows what you have actually been doing. That makes it more useful than the brochure figure and less stable, because it moves when your driving changes.
Does the EU publish real-world range figures? Not for electric cars. Since 2021 the EU has collected real consumption data from roughly 8 million cars through on-board monitoring, but the regulation lists petrol, diesel and hybrid vehicles only. Battery-electric cars are the one category left out, and there is a recommendation to include them from late 2026. Until then, every real-world range figure you see comes from a magazine, a motoring club or a crowdsourced database rather than from a regulator.
Is a bigger battery the answer? Not always. A bigger pack adds weight and often cost, and at motorway speed the thing that decides consumption is mostly how the car moves through air. Two cars with the same brochure range can be 20% apart at 70 mph.
References
All figures verified 16 September 2026.
Commission Regulation (EU) 2017/1151, Annex XXI, Sub-Annexes 1, 6, 6a and 8, as at 31 December 2020. https://www.legislation.gov.uk/eur/2017/1151
AUTO BILD. E-Autos: Reichweitentest mit 100 und 130 km/h, 27 November 2023. https://www.autobild.de/artikel/e-autos-reichweitentest-mit-100-und-130-km-h-23453337.html
Green NCAP. Laboratory tests, individual vehicle assessments, and BAB Motorway Test Procedure v3.0.0, June 2025. https://www.greenncap.com/laboratory-tests/
Green NCAP. From range anxiety to charging time: Green NCAP tests show how today's EVs perform in the real world, 6 November 2025. https://www.greenncap.com/press-releases/from-range-anxiety-to-charging-time-green-ncap-tests-show-how-todays-evs-perform-in-the-real-world/
Green NCAP. Battery Capacity Test Procedure v2.1.0, June 2025. https://www.greenncap.com/wp-content/uploads/GNT_Battery_Capacity_Test_Procedure_v2.1.0.pdf
Department for Transport. Vehicle speed compliance statistics for Great Britain: 2024, published 25 June 2025. https://www.gov.uk/government/statistics/vehicle-speed-compliance-statistics-for-great-britain-2024
ICCT. The bigger the better? How battery size affects real-world energy consumption, April 2024. https://theicct.org/publication/the-bigger-the-better-april24/
ICCT. On the way to 'real-world' CO2 values?, June 2026. https://theicct.org/wp-content/uploads/2026/06/ID-627-%E2%80%93-Real-world-CO2-values_report_final.pdf
ADAC. Stromverbrauch von Elektroautos im Test, updated 20 July 2026. https://www.adac.de/rund-ums-fahrzeug/elektromobilitaet/elektroauto/stromverbrauch-elektroautos-adac-test/
Bjørn Nyland range tests, 90 and 120 km/h, via the zerofy.net database. https://www.zerofy.net/ev-database.html